


Energy and utilities
Your grid’s own AI.
Load, price and grid forecasts from your own meters and markets.

The peak comes in the early evening, slightly above last week 1. The band is wider in the morning because of the weather forecast 2.
- 1Meter history, eastern grid
- 2Weather forecast, today
Illustrative
- Tasks to start with. A Test Lab takes one.
- 3
- The Formula it starts withWith OLM
- TLM
- To roll back to the last release, by design
- 60 s
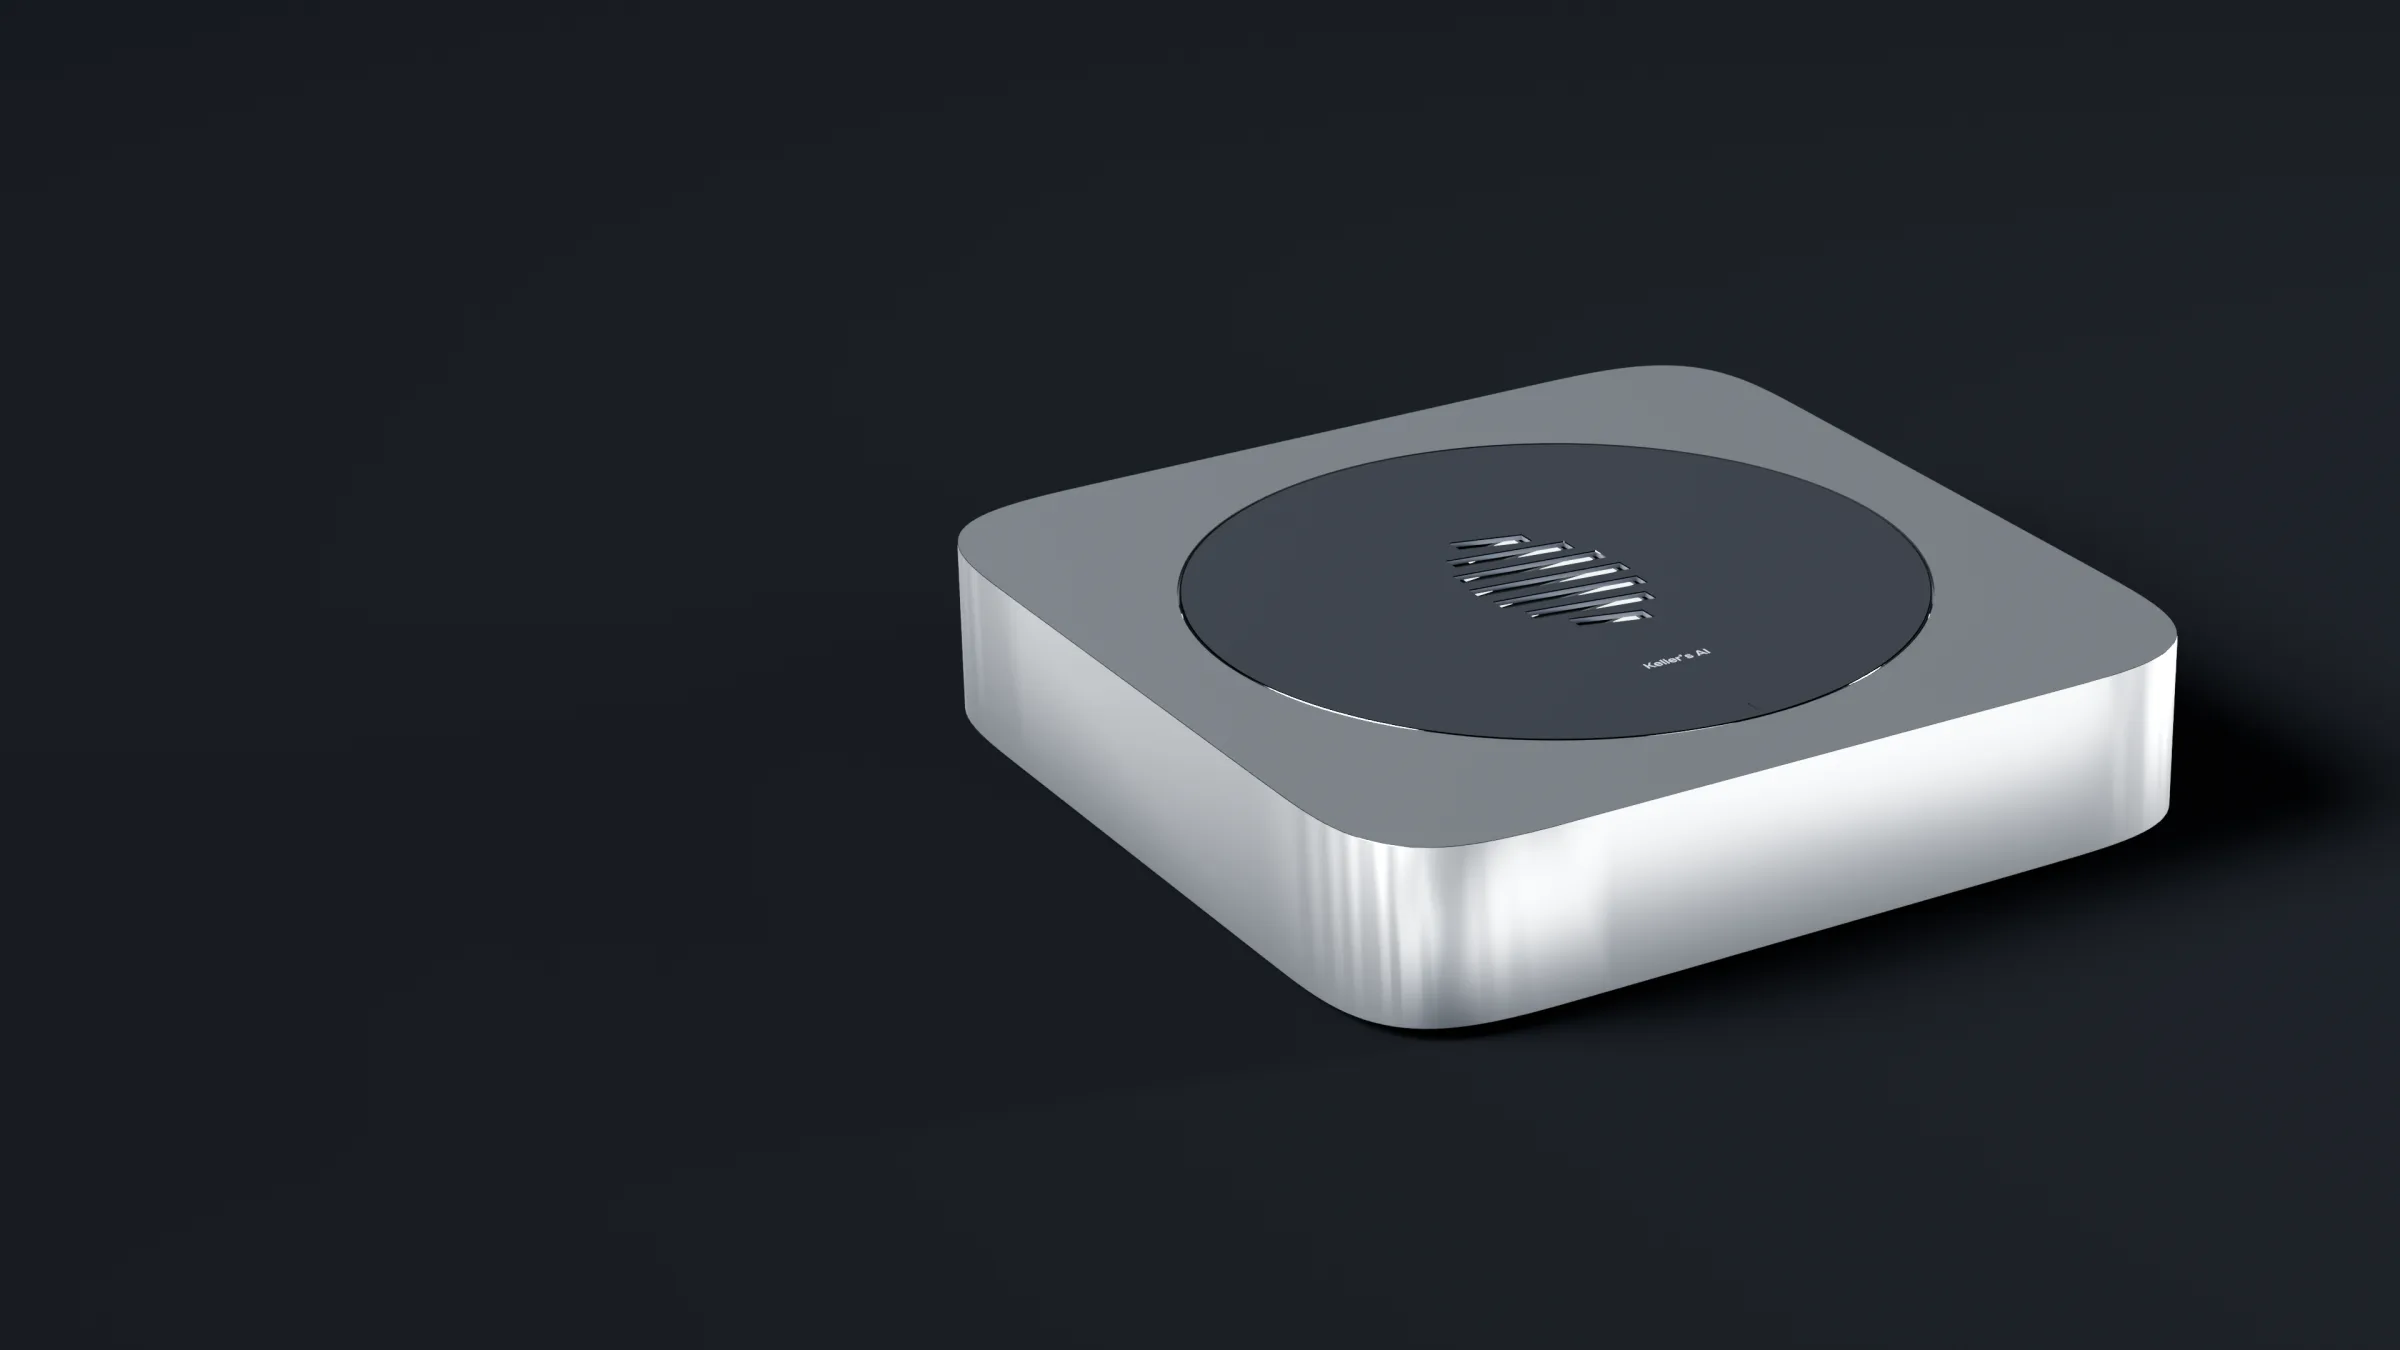
- Eigna Local. Data never leaves.
- Local

The work that cannot leave
Meter and grid data are critical infrastructure. They stay under your control, and forecasting fits the time series models we build first.
- Meter data
- Grid and plant data
- Market positions
- Inspection records
Where it runs, for energy
Eigna Local
Data never leaves.
On your own servers, inside your network.
Training runs on a GPU we rent in a region you approve: an encrypted snapshot goes there for each run and is deleted after it. Where nothing may leave your network, it runs on your own GPU.
The first expert
Three tasks to start with.
Forecasts, reports and decisions approved by your operators.
Load and price forecasts
Trained on your own meters and markets.
The peak comes in the early evening, slightly above last week 1. The band is wider in the morning because of the weather forecast 2.
- 1Meter history, eastern grid
- 2Weather forecast, today
Learns from · Forecasts your operators accepted, and your meter history.
Maintenance
Learns from your inspections and fixes.
Four units, ranked by temperature trend and age 1. One showed the same pattern before its last fault 2.
- 1Sensor history, substations
- 2Fault report, approved
Learns from · Inspections and fixes your crews closed.
Outage reports
Drafts the report from the alarm log and the network model.
A draft in your report format, with the timeline from the alarm log 1 and the customers affected from the network model 2. The cause is marked as not yet confirmed.
- 1Alarm log
- 2Network model
Learns from · Reports your control room signed off.
The proof we will measure
A metric, a baseline and a sealed test, agreed before we start.
The target is set with you before the Test Lab starts. If the expert does not beat your baseline, you keep the report.
17.8%
Our first training run cut forecast error 17.8% against its base model. It is not yet ahead of a simple last value baseline, and we publish that too.
Rules in plain words
What the rules ask, and what every release gives you.
- 01
Critical infrastructure
The EU AI Act lists critical infrastructure in its Annex III. Those high-risk duties apply from 2 December 2027.
- 02
Tested on unseen weeks
Every release is tested on weeks it never saw, and goes live only when it beats the current model.
- 03
A record of every release
A named owner, a Model Deed and rollback in 60 seconds. Designed to support your compliance work.

Energy and utilities
Tested on weeks it never saw.
A forecast goes live only when it beats your current model, storms and holidays included. Meter data stays on your own servers.
Energy: questions and answers
Can it replace our forecasting model?
Only if it beats it. The Test Lab measures it against your current model on held-out weeks. If it does not win, you keep the report.
Where does meter data go?
With Eigna Local the model runs on your own servers. Where nothing may leave your network, training runs on your own GPU.
What about unusual weeks?
They are in the test. A forecast that fails on storms or holidays does not pass the gate.
Test Lab
Request a Test Lab for energy.
One task, your data, a sealed setup, about four weeks. If the expert beats your baseline, the test set becomes your first release gate. If not, you keep the report.
- RouteDirect, and through infrastructure partners.
- Watch forCritical infrastructure means long reviews. Forecasting is the fastest first task.
- ReplyWithin two working days, from a founder.